 The Weather at
Armidale NSW
A compilation of present and past weather at Armidale NSW Australia
Armidale is
located on the Northern Tablelands of New South Wales, elevation 987 metres
All information from Bureau of Meteorology weather stations in Armidale
IMAGE: Typical autumn scene in north
Armidale. Trees in their autumn colours
beneath clear blue skies. ©Image by
weatherarmidale.com
The rural city of Armidale has two weather
stations operated by the Bureau of Meteorology - the city weather station which
is located in the Armidale valley at East Armidale, elevation 987 metres, and the airport weather station which is five kilometres to the south west, elevation 1,079 metres.
The city station is manually operated reporting at 9am daily. The airport
station is automated and reports to the Bureau every ten minutes.
Unless otherwise specified, all information in these pages is sourced from the
Armidale city weather station.
Further details on Armidale’s weather stations here.
Armidale Airport: Current temperature and wind information from
the airport HERE.
Note: The airport is 92 metres higher and five kilometres
from the city weather station resulting in slightly different weather
conditions occurring there. Winds are usually around 10 to 15 kms per hour
stronger at the airport. Day temps are about one degree lower, and night and
early morning temps can be around two to four degrees higher at the airport.
Armidale City Weather Station -
click button below for current conditions:
Note: If temperature is
shown in degrees F, go to settings icon at top right of screen and select
degrees C.
Latest maximum/minimum temps and 24 hour rainfall, updated daily
9.30-10am (refresh page to update)
 Yesterday’s max 13 May: 17.3C This morning’s min 14
May: 8.5C
Yesterday’s max 13 May: 17.3C This morning’s min 14
May: 8.5C
Rainfall 24 hours to 9am today 14
May: 0.4
mm
Last
Rain: 14 May Next
Rain: 14 May (based on latest forecasts,
may change)
Armidale
Forecast
Guyra Weather
Guyra
weather website
Reviews
& Charts in
PDF format - printable
ARMIDALE APRIL 2026 WEATHER REVIEW
ARMIDALE SUMMER
2025/26 WEATHER REVIEW
ARMIDALE 2025 ANNUAL WEATHER REVIEW
ARMIDALE LONG
TERM AVERAGES & EXTREMES Updated to 2025
RAINFALL CHART for your
farm/home rainfall recordings
This
Month - May 2026
Total Rainfall up to 9am on 14 May:
15.4 mm (average 45 mm)
This Year - 2026 up to 14 May:
Total Rainfall: 144.4 mm (Jan-Apr av: 302 mm, annual av: 784 mm)
Highest Daily
Rainfall: 21.8 mm
on 22 Feb
Highest Temperature: 36.4C on 26 Jan
Lowest Temperature: -2.6C on 9 May
Hot Days - Temp 30.0C or higher: 20 (average: 17 days)
Cold Days - Maximum below 10.0C: 0 (average: 13 days)
Cold Mornings with Frosts: 13 (average: 96)
Weather News 2026
 (using information from Armidale City weather
station)
(using information from Armidale City weather
station)
WARMEST MAY DAY FOR 10
YEARS - 4th May - The maximum temperature of 24.4C was the highest for the month of May
since 8th May 2016 when 24.8C was recorded. The unusually warm conditions were
caused by north-westerly winds drawing warm air into New South Wales ahead of a
cold front and trough which passed through the region early on the 5th.
APRIL RAINFALL TOTAL: 4.8 mm on 4
days, 40 mm lower than the average, and was the driest April since 2019 which
recorded 3.0 mm. Rainfall has been below average in the first four months of
2026 with only 43 per cent of the normal rainfall recorded for this
period.
Details in the April 2026 Weather Review. April 2026 daily data table.
FIRST FROST OF THE YEAR - 12th April - The first
frost for 2026 with a minimum temperature of 1.1C was recorded in the early morning, ending a 149 day frost-free
period since the last frost on 13th November 2025.
The grass (terrestrial) minimum temperature was -3.8C.
WARMEST APRIL WEATHER FOR 40 YEARS - 7th-11th April - Unusually warm conditions
prevailed over the five days as a result of very warm north-westerly winds from
the centre of Australia being directed into New South
Wales ahead of a cold front which arrived late on the 11th.
Maximum temperatures: 7th: 27.0C, 8th: 28.0C, 9th: 30.0C, 10th: 29.5C, 11th:
27.5C. The maximum of 30.0C on the 9th was the highest April temperature since
4th April 1986 when 30.2C was recorded which was also the highest on record for
the month of April.
MARCH RAINFALL TOTAL: 18.6 mm on 9
days, 49 mm lower than the average, and was the driest March since 2015 which
recorded 11.6 mm. Rainfall has been below average in the first three months of
2026 with only 48 per cent of the normal rainfall recorded for this period.
Details in the March 2026 Weather Review. March 2026 daily data
table.
COLDEST MARCH DAY FOR 37 YEARS - 27th March - The maximum temperature of 14.1C
was the lowest maximum for the month March since 26th March 1989 (which
recorded 13.5C). The unusually low temperatures were caused by cold blustery
westerly winds following a severe cold front which passed through in the early
hours of the morning. The system brought with it 3.4 mm of rain.
SUMMER OF 2025/2026 - Rainfall was
well below average while temperatures were warmer than normal. Details in the Summer 2025/2026 Weather Review.
FEBRUARY RAINFALL: 55.8 mm on 11 days, 32 mm less than the
average. The highest daily fall was 21.8 mm on the 21st from a thunderstorm.
Details in the February 2026 Weather Review. February 2026 daily
data table.
JANUARY RAINFALL: 49.8 mm on 11 days, 51 mm less than the
average. The highest daily fall was 12.6 mm on the 18th.
Details in the January 2026 Weather Review. January 2026 daily
data table.
HOTTEST DAY FOR 5 YEARS - 26th January - A low pressure trough over north-western New South
Wales directed very hot air over the state from the centre of Australia with
temperatures reaching the mid forties in many areas
west of the Divide. In Armidale the maximum was 36.4C, highest since 2nd December 2020 when 36.4C was also recorded. At
Armidale airport on the 26th the maximum was slightly higher at 36.8C.
 Weather
News 2025
Weather
News 2025
(using information from Armidale City weather
station)
THIRD
WARMEST YEAR ON RECORD - 2025 was Armidale’s third warmest year on record (from 135 years of
available data) with the mean temperature for the year
exceeding the long term average by 1.40C. The warmest year was 2024, and the
second warmest was 2019. Calculated from using the mean of both maximum and
minimum temperatures recorded throughout each year. Armidale’s five warmest
years occurred in the last 12 years which is all part of an overall warming
trend across the globe.
Details in the 2025 YEARLY WEATHER REVIEW. Includes statistics table. (PDF format
- printable)
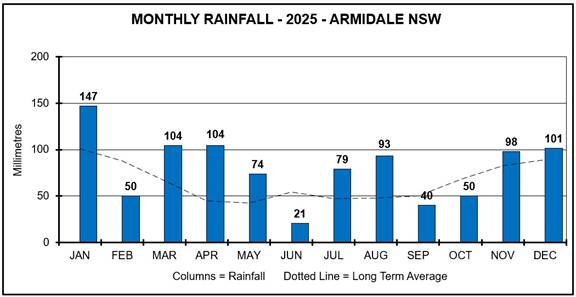
2025 TOTAL RAINFALL: 962.4 mm, 179
mm higher than the average. January was the wettest month with 147.0 mm, and
June was the driest with 20.6 mm. See graph at right.
DECEMBER RAINFALL: 101.4 mm on 8 days, 12 mm higher
than the average. Most of the rain fell in the first 12 days, the highest daily
fall was 43.4 mm on the 11th. Details in
the December 2025 Weather Review. December 2025 daily data table.
NOVEMBER RAINFALL: 98.2 mm on 14
days, 16 mm higher than the average. Most of the rain fell during thunderstorms
with the highest daily fall being 21.2 mm on the 26th. Details in the November 2025 Weather Review. November 2025 daily data table.
WARMEST OCTOBER ON RECORD - Based on maximum temperatures October 2025 was
the warmest October on record. The average maximum of 24.6C was the highest of
record (from 134 years of records since 1891). The previous warmest Octobers
were in 2019 and 1896. The unusually warm temperatures were the result of
numerous low pressure troughs directing very warm air into New South Wales from
the centre of Australia.
OCTOBER RAINFALL: 50.0 mm on 5 days,
18 mm less than the average. The majority of the rain (35.4 mm) fell over two
days - the 28th and 29th. Details in the October 2025 Weather Review. October 2025 daily data
table.
COLDEST OCTOBER DAY FOR 13 YEARS - 28th October - The maximum temperature
of 10.6C was the lowest for the month of October since 12th October 2012
when 7.7C was recorded. This was the result of two weather systems - a low
pressure trough generating cloud and rain over northern New South Wales
combined with a cold southerly change moving into the north of the state during
the day.
WARMEST OCTOBER DAY FOR 6 YEARS - 21st October - The maximum temperature of
32.2C was the highest for the month of October since 7th October 2019
when 32.4C was recorded. Temperatures over 30.0C in October are uncommon, and
on this occasion it was caused by north-westerly winds bringing in very warm
air from the centre of Australia ahead of a cold
front which passed through eastern New South Wales the following day, the 22nd.
SEPTEMBER RAINFALL: 40.2 mm on 6
days, 10 mm less than the average. There were two moderate rain events -
10th-11th (18.0 mm), and 19th-20th (20.6 mm). Details in the September 2025 Weather Review. September 2025 daily data table.
COLDEST SEPTEMBER DAY FOR 14 YEARS - 11th September - Cold south-westerly
winds following the passage of a cold front the previous day resulted in a
windy cold day with a maximum temperature of just 9.1C. This was the
lowest maximum for the month of September since 9th Sep 2011 (8.1C).
WINTER 2025 - It was a cloudy wet winter with less sunshine than normal and
fewer frosts than normal. Day temperatures were close to normal, but overnight
temperatures were higher than normal. Details in the Armidale Winter 2025 Weather Review.
AUGUST RAINFALL: 93.0 mm on 8 days,
45 mm higher than the average, and was the wettest August since 2016 (143.0
mm). The majority of the rain fell in two events: 1st-4th: 56 mm,
and 20th-21st: 35.8 mm. More details in the August 2025 Weather Review. August 2025 daily data table.
NORTHERN TABLELANDS HEAVY SNOWFALLS - 2nd August - Snow fell over a wide area of the Northern Tablelands during the day. In
Armidale a winter wonderland scene presented itself to residents as large
snowflakes fell from around 9.30am. By 11am snow had started to settle on the
ground and there was a thick cover by 4pm, depth on open ground varying between
around 6 to 10 cm. After eight continuous hours the snow stopped falling at
around 5.30pm.
The snow also extended south to Walcha and the Moonbi Range, east along the Snowy Range to Ebor, north to Guyra, Glen Innes, and across the border to the Granite
Belt with light falls around the Stanthorpe area, and
also west to Bundarra and the Narrabri area. The New England Highway was closed
north and south of Armidale, and also the Waterfall Way east to Ebor due to
snow and fallen trees on the roads. Many areas also experienced loss of
electricity for extended periods due to fallen trees across power lines.
The following morning, 3rd August, snow remained on the ground throughout the
city before gradually melting throughout the day. Depth at the weather station
at 9am: 6 cm.
The snowfalls were the result of upper level cold air over northern New South
Wales combined with moisture from the east along a surface low pressure trough
associated with an intense low pressure system off the New South Wales North
Coast. This was Armidale’s heaviest snowfall since the big snow event on
3rd-4th July 1984.
From 9.30am for the remainder of the day the temperature stayed between zero
and 1.5C. The maximum (9am to midnight) of 2.5C occurred at 9.00am, and was the
lowest maximum temperature on record for any month (from 86 years of available
records). The previous lowest was 2.6C on 3rd July 1984 recorded at the East
Armidale site, and 2.6C on 22nd June 1949 recorded at the Armidale Post Office.
JULY RAINFALL: 79.2 mm on 13 days,
wettest July since 2012. Most of the rain fell during the second half of the
month, the highest daily fall was 24.8 mm on the 18th. Details in the July
2025 Weather Review. July 2025 daily data table.
COLDEST MORNING FOR 2 YEARS - 17th July - The minimum of -7.1C
recorded at 6.30am was Armidale city’s lowest temperature since 20th July 2023
when -9.2C was recorded. The cold conditions were caused by clear skies with no
wind throughout the night and early morning. The minimum at Armidale Airport
was a milder -2.0C as the result of a temperature inversion, a common event on
calm clear winter nights where cold air drainage causes temperatures in valleys
to be colder than nearby higher areas.
JUNE RAINFALL: 20.6 mm on 8 days, 34
mm less than the average. Daily falls were mostly light with the highest daily
fall being 7.4 mm on the 25th. Details in the June
2025 Weather Review. June 2025 daily data table.
COLD OUTBREAK AND SNOW - 9th June - Very cold, windy and showery conditions
affected the Northern Tablelands with light snowfalls in the higher areas
including Black Mountain, Guyra and Ben Lomond. In
Armidale there was no snow apart from a few snowflakes mixed with rain showers
during the morning. The extreme weather conditions were the result of very cold
south-westerly winds following a front and low pressure trough combined with
upper level cold air. The maximum temperature in Armidale on the 9th was 7.4C,
although it felt much colder due to the strong westerly winds.
UNUSUALLY CLOUDY MAY WEATHER CREATES NEW RECORDS - A high number of low
pressure troughs affected New South Wales during the month generating a greater
than normal number of cloudy days and nights. These conditions resulted in the
following new records for the month of May.
Average minimum temperature for the month of 7.4C was the highest on
record at the East Armidale site (long term average 3.0C from 44 years of
records). The previous highest was 7.0C in 1989.
Frosts - only two frosts occurred, lowest on record (long term average
14 frosts from 44 years of records). The previous May lowest was 4 frosts in
1992. The first frost on the 24th also created a new record for the latest
start to the frost season. The previous record was 22nd May 1989.
Sunny days - there were only 4 sunny days, lowest on record (long term
average 15 days from 40 years of records). The previous lowest for May was 6
days in 1991 and 1995.
MAY RAINFALL: 73.8 mm on 21 days, 31
mm higher than the average. Most daily falls were light with the exception of
34.4 mm on the 22nd.
Details in the May 2025 Weather Review. May 2025 daily data
table.
FIRST FROST OF THE YEAR - 24th May - The first
frost for 2025 with a minimum temperature of 1.3C was recorded in the early morning, ending a 241 day frost-free
period since the last frost on 24th September 2024. This was the latest start
to the Armidale frost season on record at the present weather station site from
44 years of records. The previous record was 22nd May 1989.
RAIN EVENT - 19th-22nd May
- An
intense low pressure trough developed off the New South Wales Hunter coast on
the 19th generating flooding rains to the Newcastle region. The trough moved
north to the Mid-North Coast on the 20th producing further heavy rain on the
20th, 21st and 22nd resulting in devastating floods, particularly around the Taree area with over 300 mm recorded in some areas.
Armidale was on the northern edge of this system recording 46.6 mm of rain over
the 19th to 22nd.
APRIL RAINFALL: 104.4 mm on 11 days,
59 mm higher than the average. Most of the rain fell in two events - from the
1st to the 3rd (33 mm), and from the 21st to the 27th (69 mm), with the highest
daily fall being 41.8 mm on the 27th. April 2025 Weather Review. April 2025 daily
data table.
EVENING DOWNPOUR - 26th April - A low pressure trough over northern inland
New South Wales combined with humid easterly winds off the Tasman Sea produced
areas of heavy rain and thunderstorms over the north of the state. Armidale
city recorded its highest daily fall of rain so far this year with 41.8 mm
recorded for the 24 hours to 9am on the 27th. Most of this rain (approx 36 mm) fell between 5pm and 10pm on the 26th.
Armidale airport recorded a slightly lower total for the 24 hours of 34.6 mm,
and Guyra recorded 25 mm.
WET START TO APRIL - 1st-3rd April - A low pressure trough over inland
Queensland moved south to the New South Wales border region on 1st April
bringing moderate falls of rain to the north-east third of New South Wales on
the 1st, 2nd and 3rd. Armidale recorded a total of 35.0 mm over this period,
and Guyra recorded 39 mm.
MARCH RAINFALL: 104.4 mm on 17 days,
37 mm higher than the average. The highest daily fall was 24.8 mm on the
29th. Details in the March 2025 Weather Review. March 2025 daily
data table.
RAIN EVENT - 28th-30th March - A low pressure system which formed over
southern Queensland on Friday the 28th moved into New South Wales on the 29th
moving rapidly through the inland of the state and out into the Tasman Sea off
the south coast on the 30th. This system brought flooding rains to areas of
both inland Queensland and New South Wales. In Armidale the total rain for the
two days ending 9am on the 30th was 34.4 mm.
TROPICAL CYCLONE ALFRED - 8th-10th March - The cyclone crossed the Queensland
coast just north of Brisbane on 9th March with heavy rainfall and strong winds.
Severe flooding occurred in many areas including the New South Wales north
coast. Some of the rain from the cyclone made its way onto the Northern
Tablelands with Dorrigo recording over 800 mm on the 8th, 9th and 10th March.
Armidale recorded 28 mm during this same period, and Guyra
recorded 40 mm.
SUMMER OF 2024/2025 - Rainfall was close to average while temperatures were
warmer than normal. Details in the Summer 2024/2025
Weather Review.
FEBRUARY RAINFALL: 50.2 mm on 6
days, 38 mm less than the average, most of it falling from thunderstorms. The
highest daily fall was 24.6 mm on the 12th.
Details in the February 2025 Weather Review. February 2025 daily
data table.
JANUARY RAINFALL: 147.0 mm on
16 days, 46 mm higher than the average. Most of the rain fell during
thunderstorms. The highest daily fall was 31.2 mm on the 29th. Details in the January
2025 Weather Review. January 2025 daily data table.
SEVERE HAILSTORM - 23rd January - A severe thunderstorm with large hail
passed over Armidale from the south-west between 5.00 and 5.45pm. Large
hailstones fell from 5.10 to 5.20pm. Most of the hailstones were around 30 mm
diameter or less, but there were a number of hailstones measuring up to 40mm
diameter or golf ball size. By the end of the storm 10 per cent to 90 per cent
of the ground was covered by hail depending on which part of the city you live.
Many of the smaller hailstones were spherical or egg shaped, but the larger
ones over 30mm in diameter were irregular shaped, often a jagged conglomeration
of several hailstones fused together while forming in the storm cloud. Cars,
roofs, skylights, outdoor furniture and gardens all suffered damage in varying
degrees. After the storm cleared Armidale it continued in a
north-north-easterly direction depositing hail on rural properties and also
Black Mountain village, before dissipating east of Guyra. The severe storm was caused by a lingering
intense low pressure trough over north-east New South Wales. Heavy rain
accompanied the storm with the Armidale city weather station recording 19.4 mm
of rain and melted hail between 4.50 and 5.25pm. Armidale airport recorded 10.2
mm for the same period.
This was the sixth severe hailstorm to hit Armidale in the last 30 years.
Details of the previous five events here.
COOLEST JANUARY DAY FOR 9 YEARS - 17th January - The maximum temperature of
16.5C was 10C below the long term average, and was the lowest January maximum
since 3rd January 2016 when it was 16.2C. The unusually chilly summer day was
the result of cool south-easterly winds following a low pressure trough which
moved through north-eastern New South Wales on the 16th.
FOR WEATHER NEWS FROM PREVIOUS YEARS go to
the Weather News Archive.
TELEVISION REPORTING OF ARMIDALE’S WEATHER - Since 1st August 2015
when the Armidale city weather station ceased taking 3pm daily readings, all
three television networks (ABC, NBN, Prime) in their evening weather reports
report the day’s maximum and minimum temperatures from Armidale airport.
Unfortunately the airport temperatures are not as representative of conditions
in the city due to its higher elevation. Overnight minimums in particular are
often around 2 to 5 degrees colder at the city weather station which is located
in the Armidale valley where temperature inversions are common on calm clear
nights. More details on the reasons for temperatures differences between the
two stations and a list of Armidale’s lowest temperatures here.
Temperatures recorded at the city weather
station can be accessed from the Bureau of Meteorology after about 9.40am
here:
9am daily
summary - scroll down to Northern Tablelands.
Also here after mid-afternoon: Armidale daily
observation tables.
The previous day’s maximum and the current day’s overnight minimum in the city
are also shown at the top of this page after about 9.30am.
EVAPORATION - How
much water is lost through evaporation every day/month/year from water storages
on farms? During times of low rainfall, water loss through evaporation can be
critical for the survival of pastures, crops and livestock. Evaporation
readings have been taken at the East Armidale weather station since 1983, and
this data has been used to build up a profile for the Armidale area of this
important aspect of the weather. Details here:
Evaporation in
Armidale.
IS ARMIDALE’S CLIMATE BECOMING WARMER? Go to the
bottom of this page for the 134 year Armidale temperature graph.
SNOW IMAGES - Gallery of snow
photographs taken in various locations on the Northern Tablelands since 1984:
Snow images
1984 to 2015.
EBOR FALLS ICE AND SNOW (Historic
Event) - In July 2007, after several mornings of sub-zero temperatures,
Ebor Falls, 80 kms east of Armidale, partly froze and a mini snowfield was
created by spray at the base of the falls. Photographs of this amazing event here.
Forecast Rainfall
Where will it fall,
when will it fall, and how much is likely to fall?
Click HERE to
access the Bureau of Meteorology's four day rainfall predictions.
This Month’s Daily Data
Click HERE
for daily data for this month compiled by the Bureau of Meteorology. Data is
from the city weather station at East Armidale except for wind and pressure
readings which sourced from the Armidale Airport weather station.
More detailed daily data can be found HERE.
May in Armidale - what can we expect?
Normal conditions in May…
Winter still hasn't fully arrived in May. The cool to
mild autumn "golden days" continue, but nights are getting that real
winter chill as the frost season sets in. Morning fogs are common, but are
usually followed by pleasant sunny days. A cold snap may plunge us into winter
conditions for a few days before becoming milder again. Winds are light
westerlies, and rainfall is sporadic and light - May is normally the driest
month of the year.
It rarely snows in May. The last May
snowfalls were in 2008 when there was a light settling fall in the evening of
May 17th.
Average max temp: 16.4
deg Average
min temp: 3.1 deg
Average rainfall: 42.7 mm on 8
days
Average fine sunny days: 15
Average days with thunderstorms:
1
Average frosts: 14
Average hours of sunshine per day: 4.8
Hottest: 24.8 deg on 8th May
2016 Coldest: -8.8 deg on
23rd May 1982
National
Climate Centre outlook for May 2026:
The El Nino
Southern Oscillation Index is close to neutral meaning little effect on
Australia’s weather, although computer models predict that an El Nino event is
likely to develop by the middle of winter 2026. La Nina events (sustained
positive SOI values) can cause higher than normal rainfall over eastern
Australia, while El Nino events (sustained negative SOI values) usually cause
lower than normal rainfall along with warmer than normal temperatures in the
southern two thirds of the continent.
The Indian Ocean
Dipole is currently close to neutral, but computer models indicate the
possibility of a positive IOD over the winter and spring months of 2026. A
positive IOD usually leads to reduced rainfall over central and south-east
Australia, while a negative IOD can lead to above average rainfall.
Armidale in May 2026 - Rainfall
lower than the long term average.
Maximum temperatures higher than the long term average. Minimum temperatures
close to the long term average.
Armidale Weather
- THE CLIMATE
- RECORDING THE
WEATHER - HISTORY & INSTRUMENTATION
- WEATHER NEWS ARCHIVE - interesting
or unusual events from previous years
- SNOW IN ARMIDALE
- SEVERE WEATHER EVENTS
- DAILY DATA
FILES, MONTHLY & YEARLY WEATHER REVIEWS
- WEATHER DATA
EXTREMES
- EVAPORATION
Weather at Nearby Locations & Links to
Webcams & Automatic Weather Stations (AWS)
- GUYRA
Hospital
- GUYRA North
Guyra, Oban St - private AWS - go to settings
icon at top right of screen and set to deg C
- SOUTH
ARMIDALE (Armidale Suburban) - private AWS
- ARMIDALE
RURAL - 7 kms west of
Armidale - private weather webcam
- URALLA - private
AWS
- SALISBURY PLAINS
- 8 kms south-east of Uralla
- private AWS & webcam
- WALCHA - private AWS
- TENTERFIELD
- LISMORE
- McLeans Ridges 12 kms east
of Lismore - private AWS & webcam
- SNOW IN QUEENSLAND - Description and
analysis of snowfalls in south-east Queensland since 1878 by Nicholas
Oughton
DO YOU HAVE ANY
PHOTOGRAPHS OF ARMIDALE'S WEATHER? I'm always on the lookout for good weather
photos for this website. If you have any which you think look good (interesting
clouds, sunsets, hail, frosts, snow, floods etc) in
or around Armidale, please email them to me here.
Information and
statistics in these pages referring to Armidale are sourced from the Bureau of
Meteorology weather station in East Armidale, station number 56037. Some data
is also used from the Bureau’s automatic weather station at Armidale airport,
station number 56238.
Feedback or queries: here.

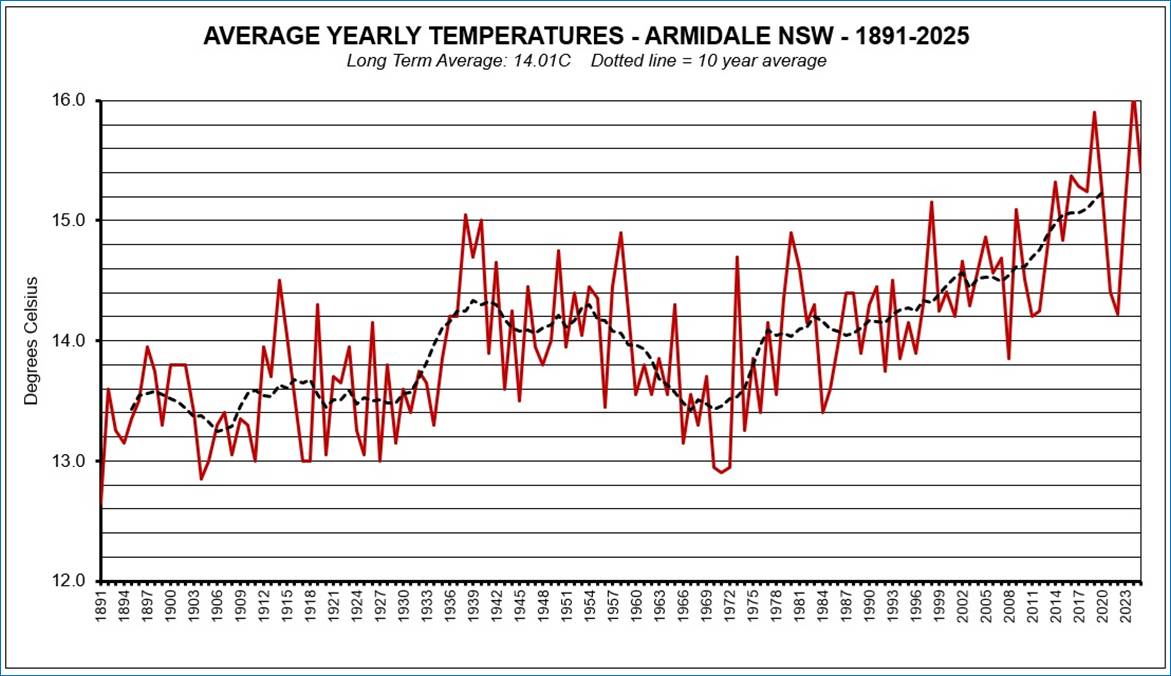
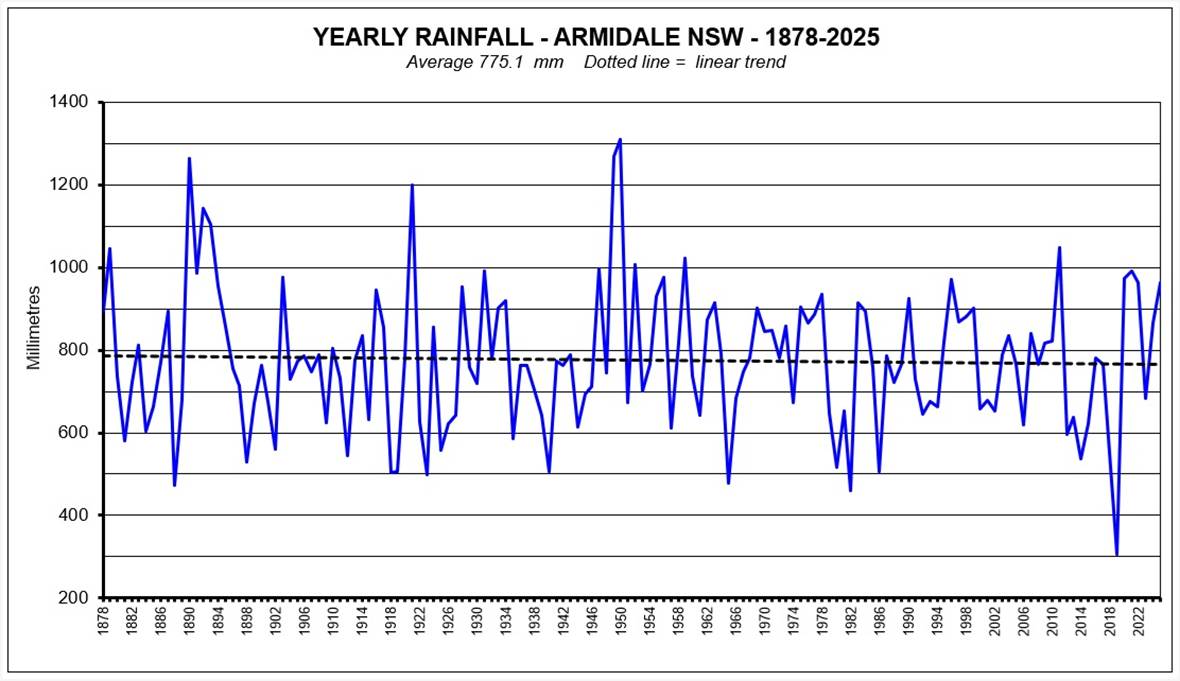
The above graph
shows the average (mean of average max and average min) temperature for each
year from 1891 to 2025.
The dotted line is the ten year average which shows periods of warming and
cooling.
Until 1997 temperatures were recorded in Armidale’s CBD. Temperatures recorded
since 1997 at the East Armidale site have been weighted to be compatible with
the earlier recordings.